Examples
Create status frequency graph from a log
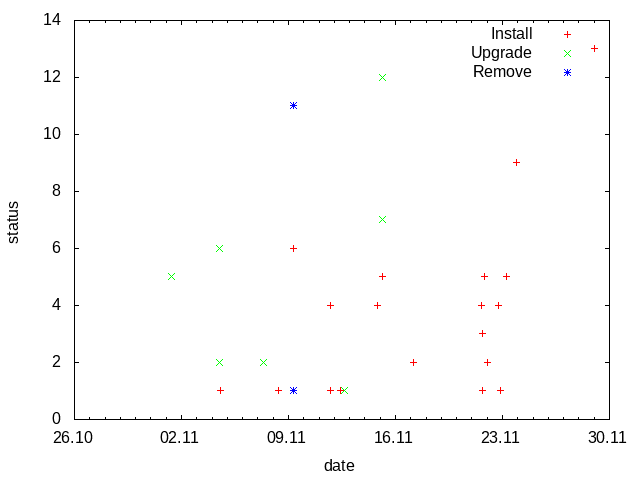
Task: Read /var/log/dpkg.log and create a graph to visualize how often packages are installed, upgraded and removed.
Solution: The loop (30) call function read_log which reads the log line by line (13), splits the fields (14) and concatenate date l[0] and time l[1] in minutes (15). Third field of the log l[2] is status of the dpkg operation(install, upgrade, remove …). zincrby (16) increments by 1 the score of word in the key l[2]. As a result the database contains keys(install, upgrade, remove …) and associated lists of words sorted by score. Next loop (33) calls the function write_csv with all keys. As a result csv files are created in the current directory with the word;score pairs.
1 2 3 4 5 6 7 8 9 10 11 12 13 14 15 16 17 18 19 20 21 22 23 24 25 26 27 28 29 30 31 32 33 34 | #!/usr/bin/python3
# Tested with python 3.6.3, python-redis 2.10.5 and redis 4.0.1
import redis
LOG_FILES = ['/var/log/dpkg.log', ]
LOG_SEPARATOR = ' '
CSV_SEPARATOR = ';'
def read_log(log_file):
''' This function reads log_file and put the status into the database '''
f = open(log_file, 'r')
for line in f:
l = line.split(LOG_SEPARATOR)
word = l[0] + ' ' + l[1][:-3]
r.zincrby(l[2], word, 1)
f.close()
def write_csv(status):
''' This function reads the database and writes the status CSV file '''
f = open(status.decode() + '.csv', 'w')
l = r.zrange(status, 0, -1, 'DESC', 'WITHSCORES')
for x in l:
f.write(x[0].decode() + CSV_SEPARATOR + str(int(x[1])) + '\n')
f.close()
r = redis.StrictRedis(host='localhost', port=6379, db=0)
r.flushdb()
for log_file in LOG_FILES:
read_log(log_file)
for status in r.keys():
write_csv(status)
|
Result: The csv files can be used to create a graph with gnuplot.
List 10 most used words in a text
Task: Read text from a file and list 10 most frequently used words in it.
Solution: Let’s use article about Redis at wikipedia.org as a text.
#!/bin/bash
lynx -dump -nolist https://en.wikipedia.org/wiki/Redis > redis.txt
To tokenize words from the text we use NLTK. NLTK data must be installed by nltk.download() (8) before word_tokenize (17) and wordnet.synsets (19) can be used. Complete NLTK data is over 3GB, hence the download is commented. zincrby (20) increments by 1 the score of word in the key topchart and zrange (23) returns top 10 words with scores.
1 2 3 4 5 6 7 8 9 10 11 12 13 14 15 16 17 18 19 20 21 22 23 24 25 | #!/usr/bin/python3
# Tested with python 3.6.3, python-redis 2.10.5 and redis 4.0.1
import redis
import nltk
from nltk.corpus import wordnet
from nltk.tokenize import word_tokenize
# nltk.download()
file = 'redis.txt'
r = redis.StrictRedis(host='localhost', port=6379, db=0)
r.flushdb()
f = open(file, 'r')
text = f.read()
words = word_tokenize(text)
for word in words:
if wordnet.synsets(word):
r.zincrby("topchart", word, 1)
f.close()
ranking = r.zrange("topchart", 0, 10, 'DESC', 'WITHSCORES')
for x in ranking:
print(x[0].decode('utf-8') + ',' + str(int(x[1])))
|
Result:
> ./create-topchart.py
is,24
a,23
in,19
edit,13
Retrieved,11
by,10
database,9
Labs,9
are,8
on,7
data,7